
Regional Development Dashboard — Ministry of National Development Planning (Bappenas)
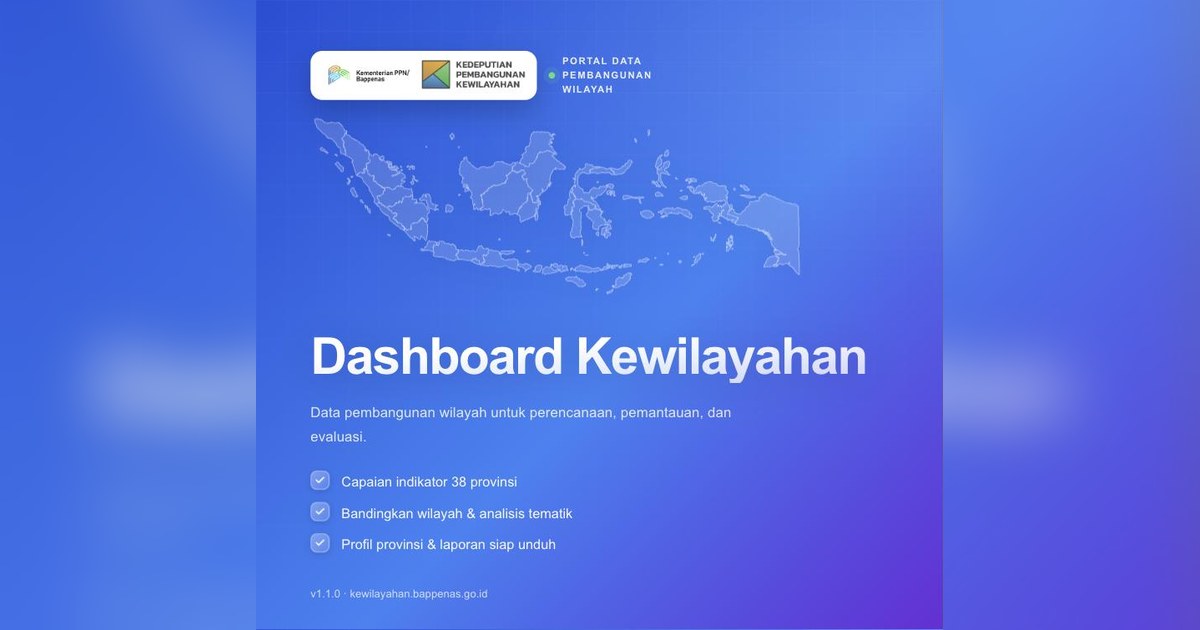
An analytics dashboard for development data across 38 provinces: indicator performance, regional comparison, thematic analysis, economic monitoring and province profiles.
Project Details
We were engaged as a subject-matter resource person and as the author of the improvement proposal for the Regional Development Dashboard of the Indonesian Ministry of National Development Planning (Bappenas) — the regional data portal used for planning, monitoring and evaluation.
Our role had two sides: delivering material and guidance on the principles of good dashboard design, then translating those principles into a clickable "after" prototype that could be presented side by side with the original version.
What was built:
- •Performance Monitoring — national indicator cards against targets, a choropleth map of 38 provinces, and a sector summary. A single region filter drives the entire page.
- •Province Profile — Summary, Economy, Inequality, Social and Spatial Planning tabs, with line and area charts, composition donuts, and ranked bar charts.
- •Regional Comparison — pick an indicator and see all 38 provinces ranked in one view.
- •Thematic Analysis — a province-by-theme matrix for spotting cross-sector patterns.
- •Regional Economic Monitoring — monthly proxy monitoring through a combined bar and line chart, plus a province-by-month heatmap.
- •Disasters & Trending Issues — a recap of events and issues currently standing out.
- •Downloadable reports — analysis summaries can be exported as PDF documents.
The design principle we pushed for: navigation should follow the user workflow, not the organisational chart. Sectors are not separate menu items but content that moves with the region filter — so the question "how is this province doing" is answered on one screen instead of scattered across many pages.